Documentation Index
Fetch the complete documentation index at: https://mintlify.com/ByteByteGoHq/system-design-101/llms.txt
Use this file to discover all available pages before exploring further.
The Three Pillars of Observability
Logging, tracing, and metrics are the three pillars of system observability. Understanding these concepts is crucial for maintaining reliable, performant systems.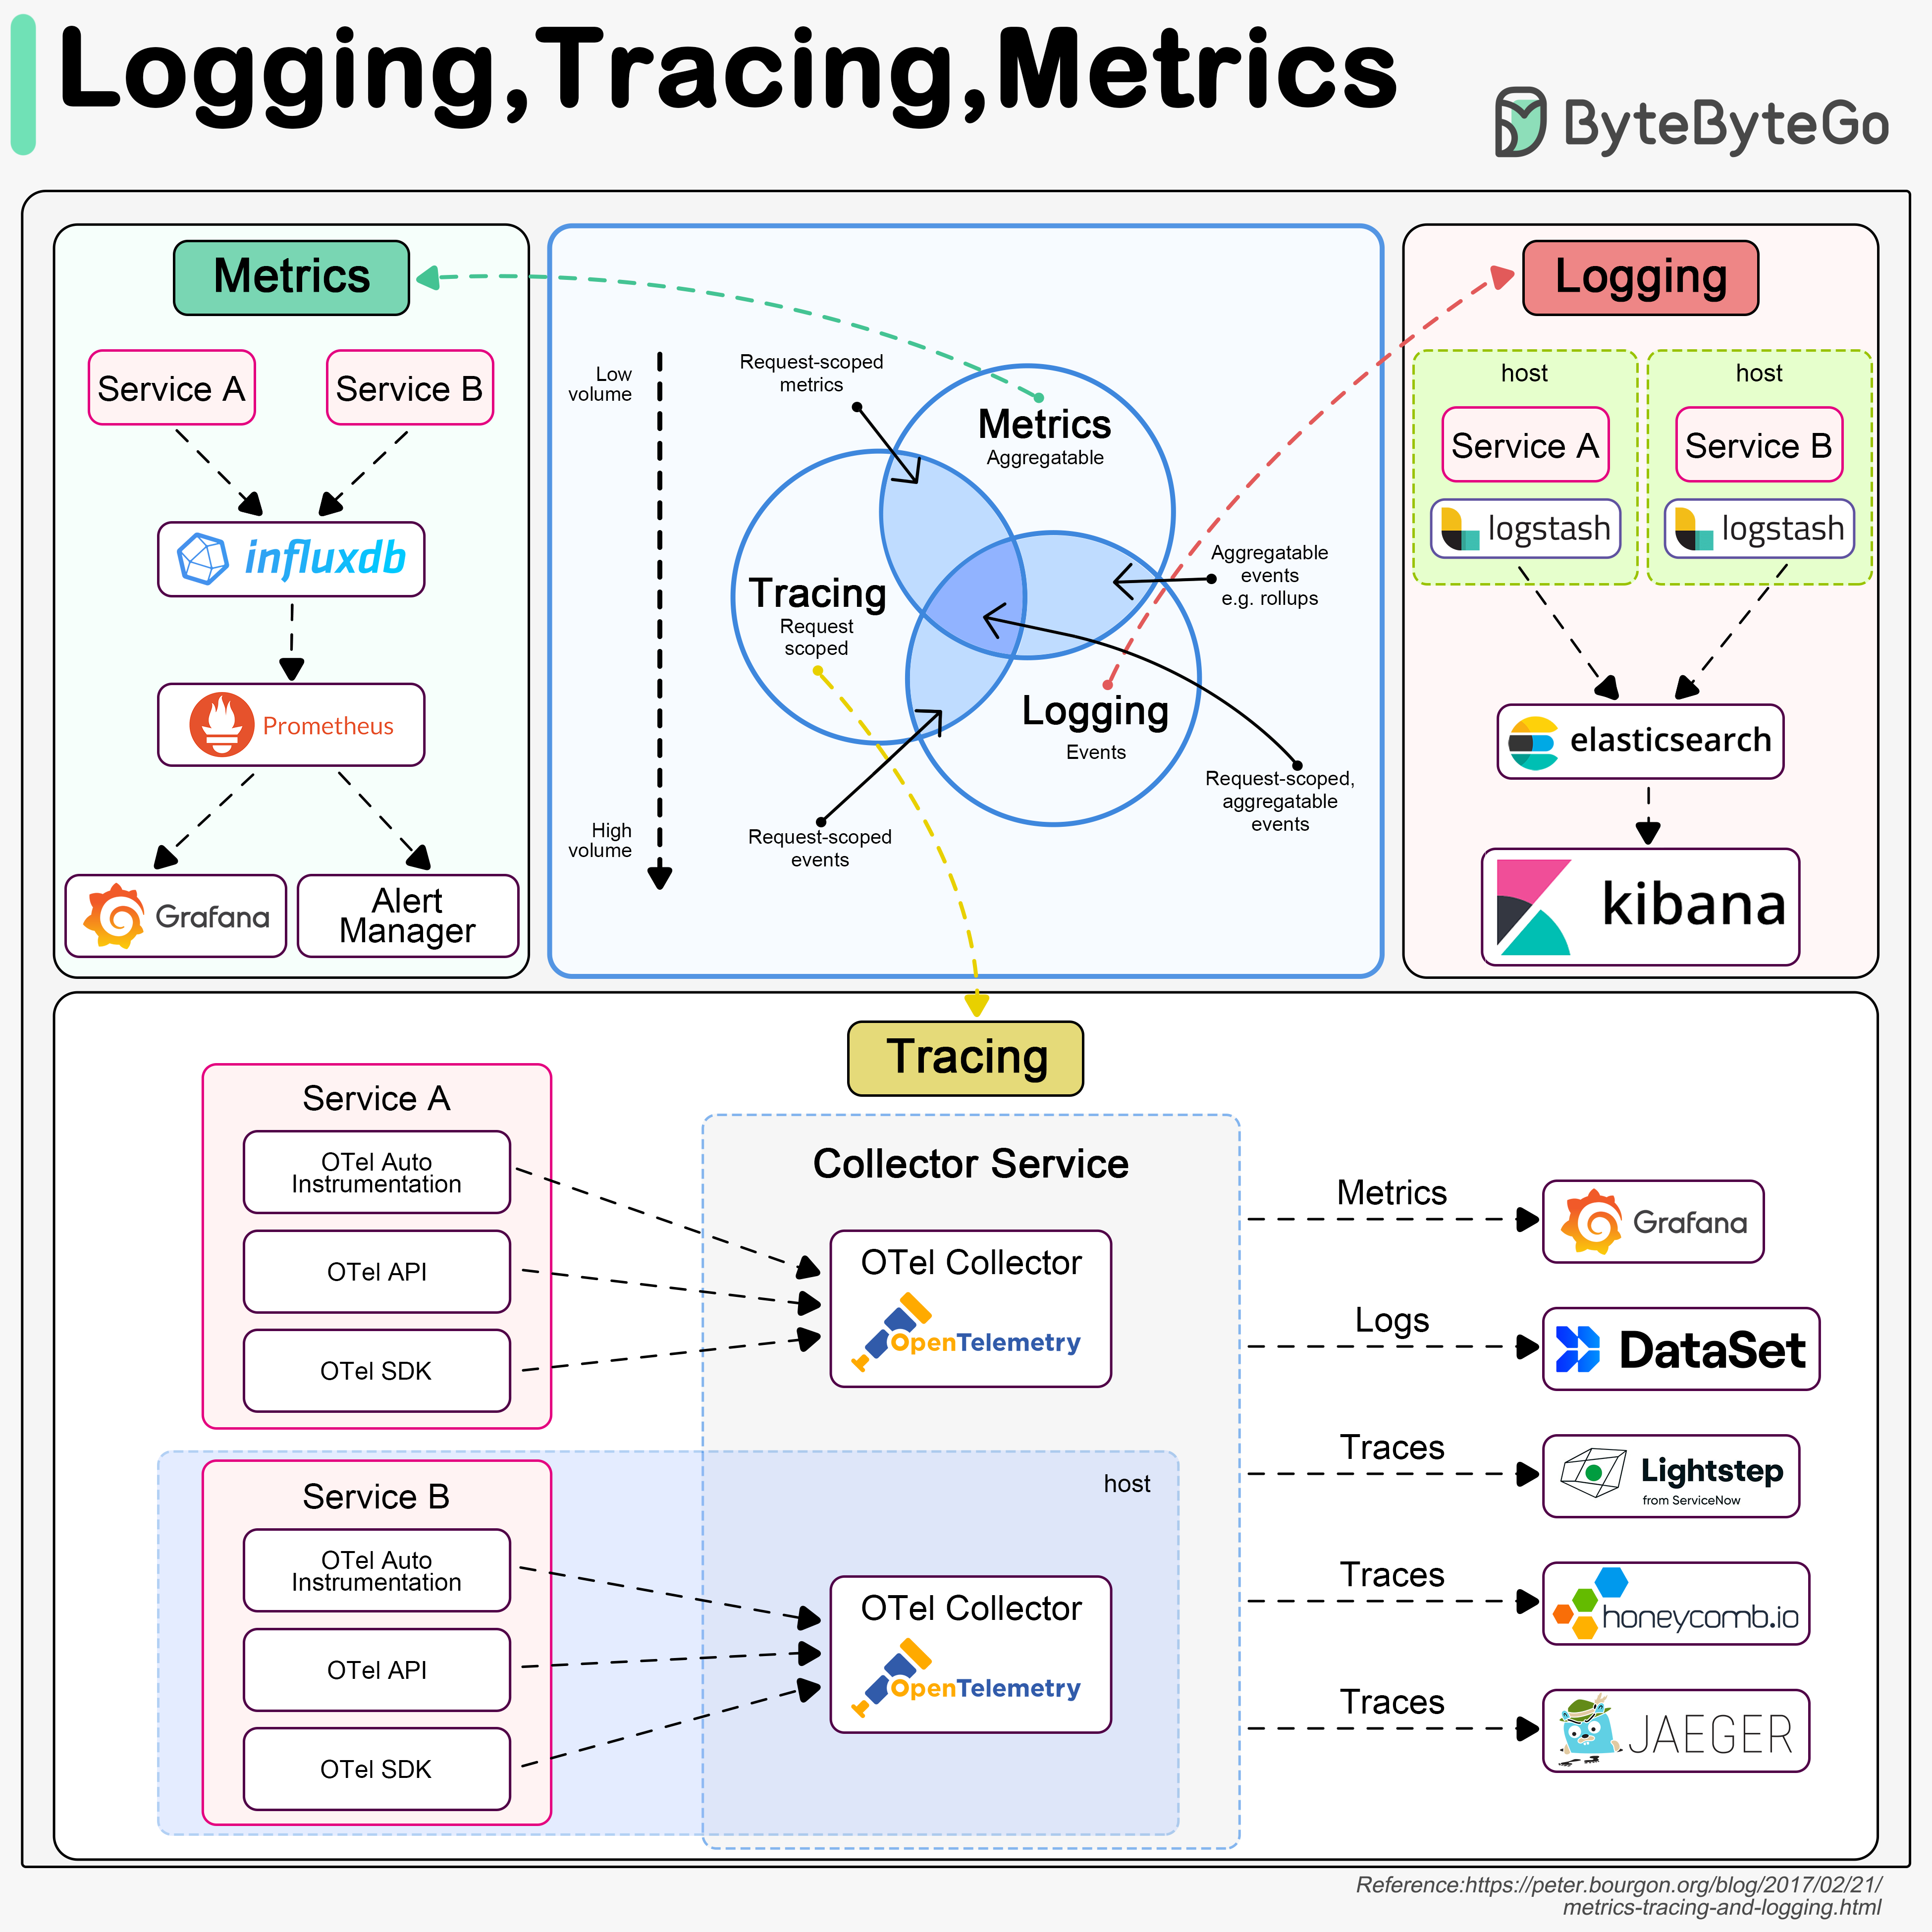
Logging
Records discrete events in the system
Tracing
Tracks requests across distributed services
Metrics
Aggregates system performance data
Logging
What is Logging?
Logging records discrete events in the system. For example, we can record an incoming request or a visit to databases as events.
Characteristics
- Highest Volume: Logs generate the most data among the three pillars
- Event-Based: Captures specific occurrences and state changes
- Searchable: Enables keyword-based investigation of issues
- Structured Format: JSON or key-value pairs for easier parsing
Typical Logging Architecture
ELK Stack (Elastic-Logstash-Kibana) is often used to build a log analysis platform. We often define a standardized logging format for different teams to implement, so that we can leverage keywords when searching among massive amounts of logs.
Logging Best Practices
Use Structured Logging
Use JSON or structured formats instead of plain text for easier parsing and querying
Define Log Levels
Use appropriate log levels to filter and prioritize:
- DEBUG: Detailed information for diagnosing problems
- INFO: General informational messages
- WARN: Warning messages for potentially harmful situations
- ERROR: Error events that might still allow the application to continue
- FATAL: Severe errors that cause premature termination
Include Context
Add relevant context like user IDs, request IDs, session IDs for correlation
Centralize Logs
Aggregate logs from all services in a central location for easier analysis
Set Retention Policies
Define how long to keep logs based on compliance and storage costs
Sanitize Sensitive Data
Never log passwords, API keys, credit card numbers, or PII
Tracing
What is Tracing?
Tracing is usually request-scoped. For example, a user request goes through the API gateway, load balancer, service A, service B, and database, which can be visualized in the tracing systems.
Why Tracing Matters
Tracing is useful when we are trying to:- Identify bottlenecks in the system
- Understand request flow across services
- Debug performance issues in distributed systems
- Calculate end-to-end latency
- Visualize service dependencies
Distributed Tracing Architecture
We use OpenTelemetry to showcase the typical architecture, which unifies the 3 pillars in a single framework.
Key Tracing Concepts
Trace
Trace
A trace represents the entire journey of a request through your system. It’s composed of one or more spans.Example: User login request from browser to database and back
Span
Span
A span represents a single operation within a trace. Each span has:
- Start time and duration
- Operation name
- Parent span ID (except root span)
- Tags and logs
Trace Context
Trace Context
Information propagated between services to correlate spans:
- Trace ID (unique identifier for the entire trace)
- Span ID (unique identifier for current operation)
- Trace flags (sampling decisions)
Sampling
Sampling
Recording only a percentage of traces to reduce overhead:
- Head-based sampling: Decide at the start of trace
- Tail-based sampling: Decide after seeing complete trace
- Common rates: 1%, 5%, 10% for high-traffic systems
Tracing Best Practices
Instrument Critical Paths
Focus on instrumenting business-critical operations and external calls
Use Semantic Conventions
Follow OpenTelemetry semantic conventions for consistent naming
Add Custom Attributes
Include business context like user ID, tenant ID, feature flags
Implement Sampling
Use sampling to reduce costs while maintaining visibility
Metrics
What are Metrics?
Metrics are usually aggregatable information from the system. For example, service QPS, API responsiveness, service latency, etc.
Metrics Architecture
Types of Metrics
Counter
Counter
A cumulative metric that only increases or resets to zero.Examples:
- Total HTTP requests
- Number of errors
- Items processed
Gauge
Gauge
A metric that can go up or down.Examples:
- Current memory usage
- Number of active connections
- Queue size
- Temperature
Histogram
Histogram
Samples observations and counts them in configurable buckets.Examples:
- Request duration
- Response sizes
Summary
Summary
Similar to histogram but calculates quantiles on the client side.Examples:
- Request duration with pre-calculated percentiles
- Processing time summaries
Essential Metrics to Monitor
- Application Metrics
- Infrastructure Metrics
- Business Metrics
Request Rate
Number of requests per second (QPS/RPS)
Error Rate
Percentage or count of failed requests
Latency
Response time (p50, p95, p99)
Saturation
Resource utilization (CPU, memory, disk)
The RED Method
A methodology for monitoring microservices:Rate
The number of requests per second
Errors
The number of failed requests
Duration
The time taken to serve requests
The USE Method
A methodology for monitoring resources:Utilization
Percentage of time resource is busy
Saturation
Amount of work resource cannot service (queue)
Errors
Count of error events
Cloud Monitoring Cheat Sheet
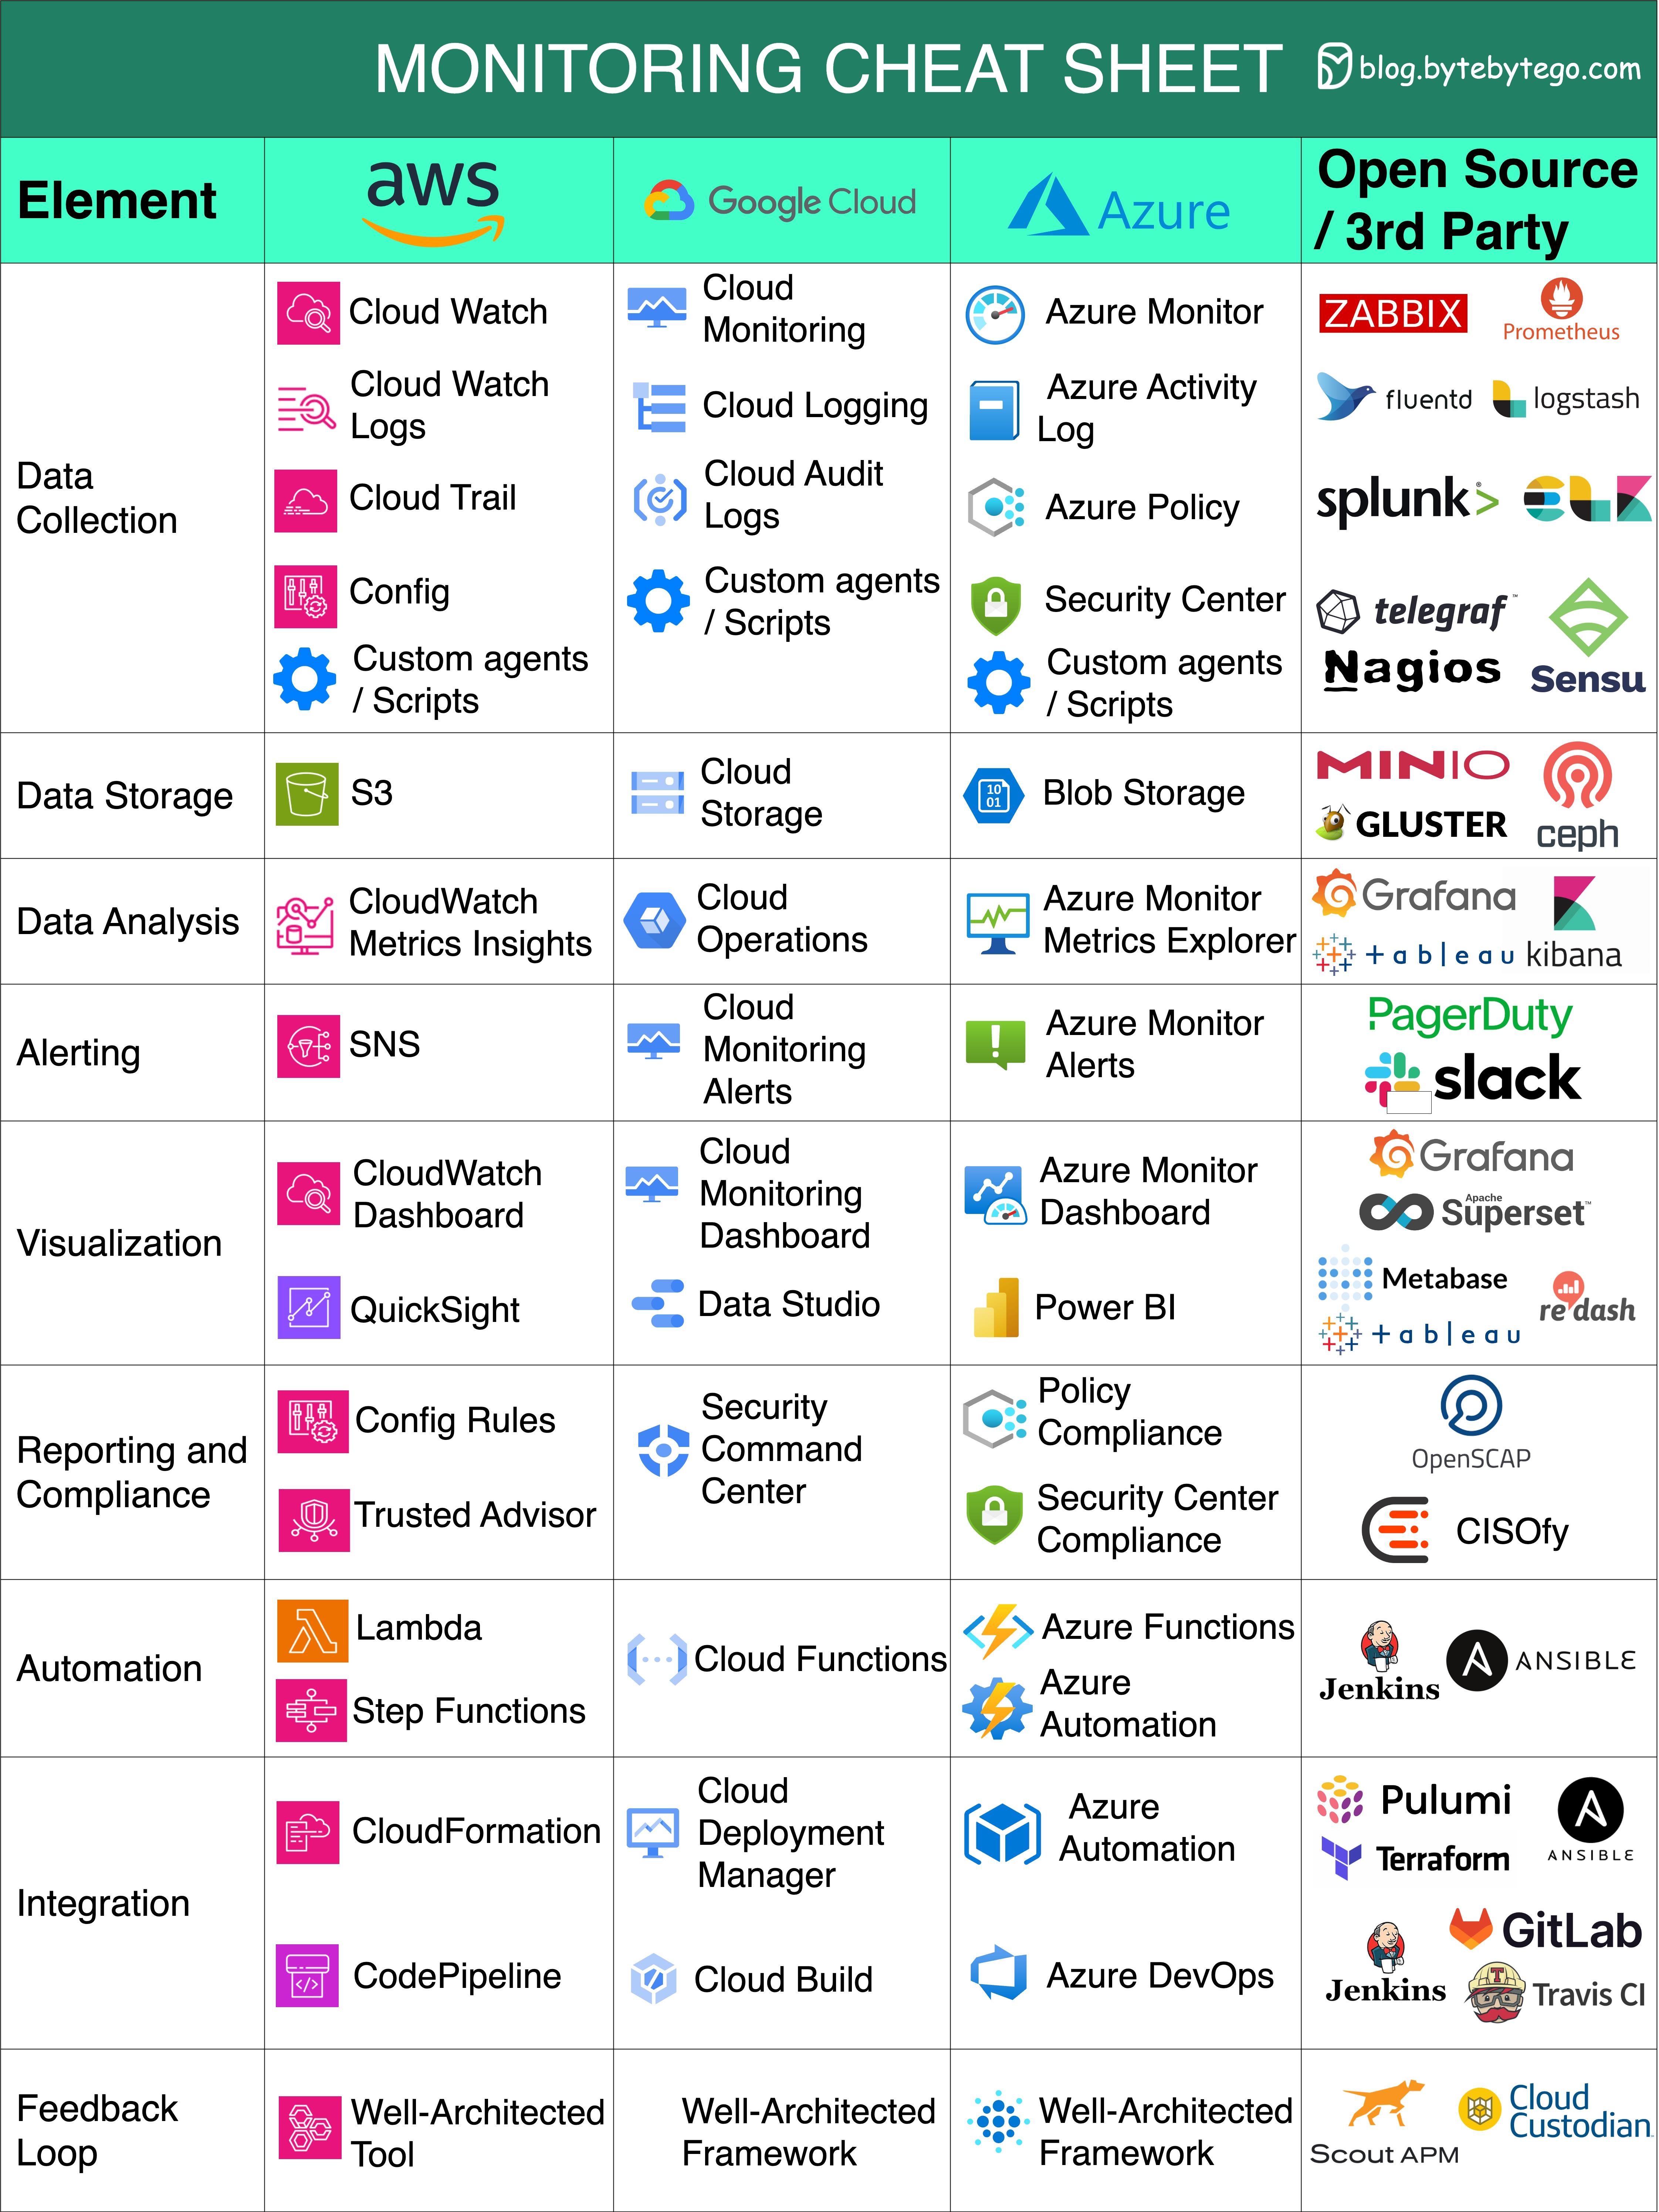
Essential Monitoring Aspects
Data Collection
Data Collection
Gather information from diverse sources to enhance decision-making.Tools:
- AWS: CloudWatch Agent
- Azure: Azure Monitor Agent
- GCP: Cloud Monitoring Agent
- Open Source: Telegraf, Prometheus exporters
Data Storage
Data Storage
Safely store and manage data for future analysis and reference.Solutions:
- Time-series databases (InfluxDB, Prometheus TSDB)
- Cloud-native storage (CloudWatch, Azure Monitor)
- Long-term storage (S3, Azure Blob, GCS)
Data Analysis
Data Analysis
Extract valuable insights from data to drive informed actions.Capabilities:
- Query languages (PromQL, KQL)
- Anomaly detection
- Trend analysis
- Correlation across metrics
Alerting
Alerting
Receive real-time notifications about critical events or anomalies.Features:
- Threshold-based alerts
- Anomaly detection alerts
- Multi-channel notifications
- Alert routing and escalation
Visualization
Visualization
Present data in a visually comprehensible format for better understanding.Tools:
- Grafana (open source)
- AWS CloudWatch Dashboards
- Azure Workbooks
- GCP Cloud Monitoring Dashboards
Reporting and Compliance
Reporting and Compliance
Generate reports and ensure adherence to regulatory standards.Requirements:
- Audit trails
- Compliance reports (HIPAA, SOC 2, GDPR)
- SLA reporting
- Capacity planning reports
Automation
Automation
Streamline processes and tasks through automated workflows.Examples:
- Auto-scaling based on metrics
- Automated remediation
- Self-healing systems
- Infrastructure as Code integration
Integration
Integration
Seamlessly connect and exchange data between different systems or tools.Integration Points:
- CI/CD pipelines
- Incident management (PagerDuty, Opsgenie)
- ChatOps (Slack, Teams)
- ITSM tools (ServiceNow, Jira)
Feedback Loops
Feedback Loops
Continuously refine strategies based on feedback and performance analysis.Practices:
- Post-incident reviews
- Performance optimization
- Capacity planning
- SLO/SLI refinement
Real-World Example: Amazon Prime Video
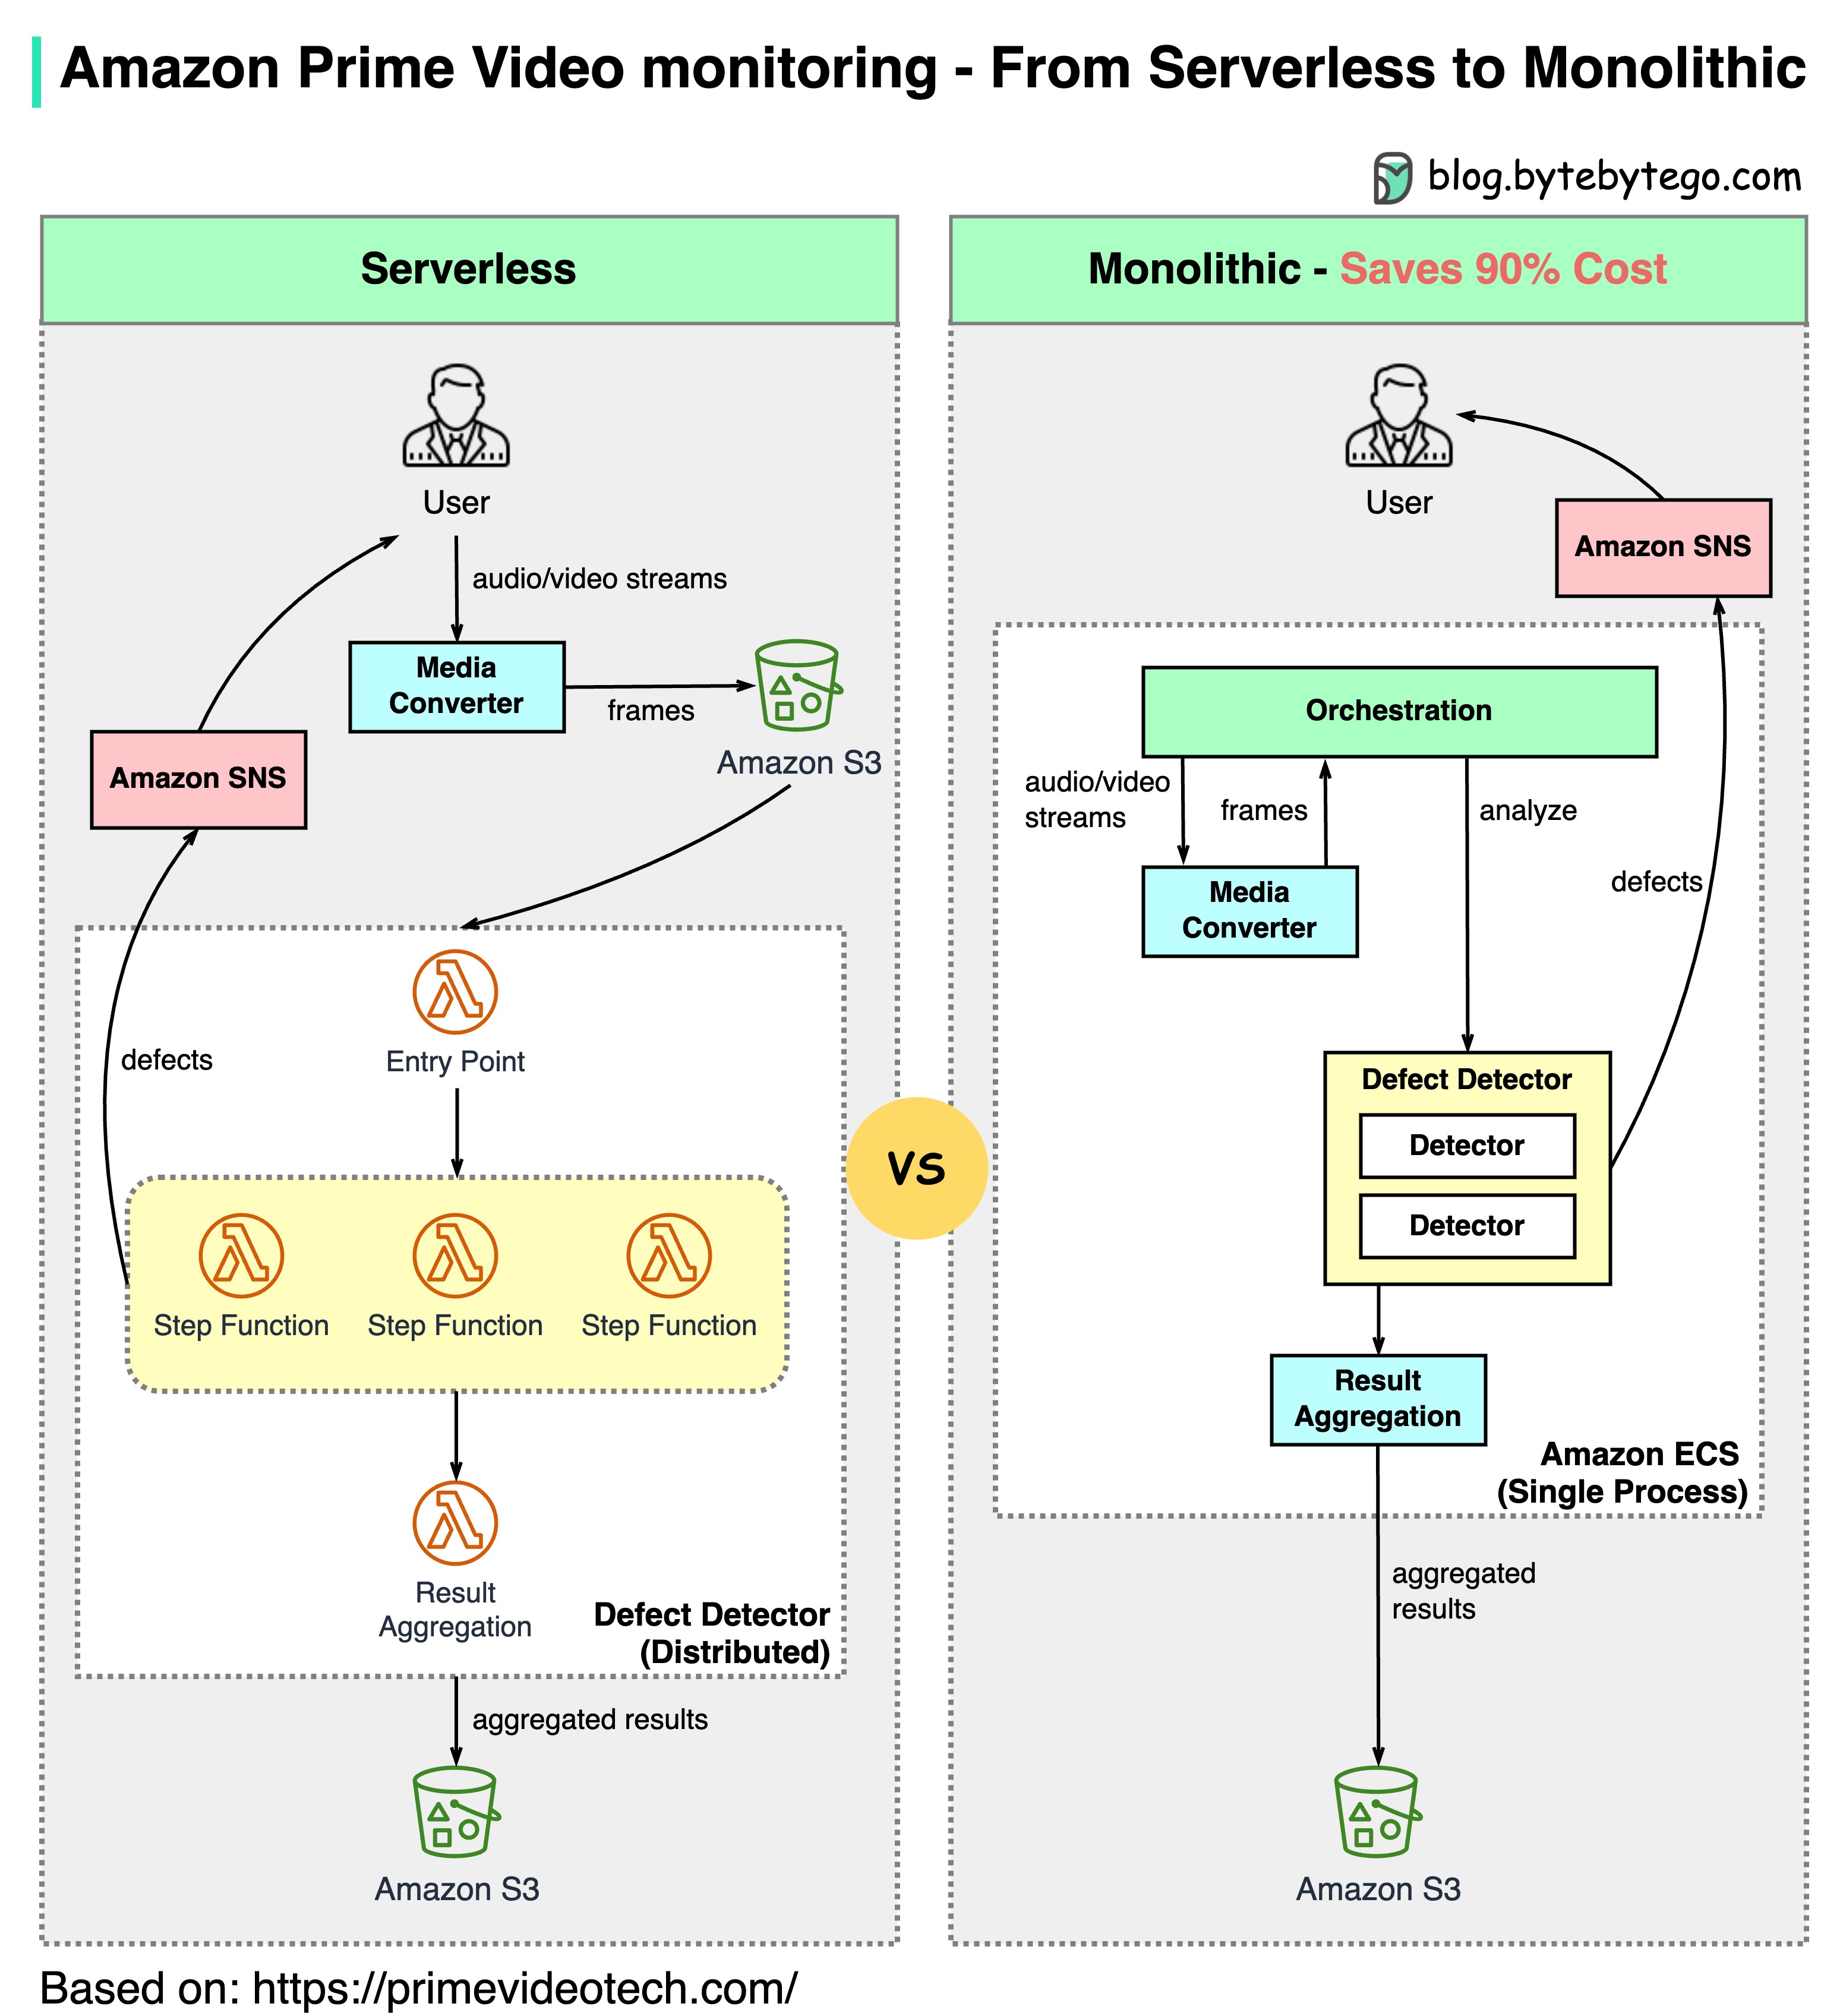
The Challenge
Amazon Prime Video needed to monitor the quality of thousands of live streams. The monitoring tool automatically analyzes streams in real time and identifies quality issues like:- Block corruption
- Video freeze
- Sync problems
Architecture Evolution
- Old Architecture (Serverless)
- New Architecture (Monolithic)
Components:
- AWS Lambda for processing
- AWS Step Functions for orchestration
- Amazon S3 for intermediate data storage
- High orchestration costs: Step Functions charge by state transitions (multiple per second)
- Data transfer costs: Intermediate data stored in S3 between stages
- Not cost-effective at scale
This is an interesting case study because microservices have become a go-to choice in the tech industry. It’s good to see honest discussions about architecture trade-offs. Decomposing components into distributed microservices comes with a cost.
Key Insights from Amazon Leaders
Werner Vogels (Amazon CTO)
“Building evolvable software systems is a strategy, not a religion. And revisiting your architectures with an open mind is a must.”
Adrian Cockcroft (Ex Amazon VP)
“The Prime Video team had followed a path I call Serverless First…I don’t advocate Serverless Only”
Observability Best Practices
Start with SLOs
Define Service Level Objectives based on customer experience:
- Availability: 99.9% uptime
- Latency: p95 < 200ms
- Error rate: < 0.1%
Implement All Three Pillars
Use logging, tracing, and metrics together for complete observability
Correlate with Context
Use trace IDs and correlation IDs to connect logs, traces, and metrics
Alert on Symptoms, Not Causes
Alert on customer-facing issues (high latency) rather than internal metrics (high CPU)
Reduce Alert Fatigue
Only alert on actionable issues that require immediate attention
Build Dashboards for Context
Create role-specific dashboards (developer, SRE, business stakeholders)
Automate Remediation
Use runbooks and automated responses for common issues
Practice Chaos Engineering
Regularly test monitoring and alerting by injecting failures
Monitor the Monitors
Ensure monitoring systems themselves are reliable and monitored
Cost Optimization
Use sampling, retention policies, and aggregation to control costs
Setting Up a Complete Observability Stack
Choose Your Tools
Select tools based on your requirements:
- Open Source: Prometheus + Grafana + Loki + Tempo
- Cloud Native: CloudWatch / Azure Monitor / Google Cloud Operations
- Commercial: Datadog, New Relic, Dynatrace
Instrument Your Applications
Add observability libraries:
- OpenTelemetry SDK for traces and metrics
- Structured logging libraries
- Application performance monitoring (APM) agents
Collect and Store Data
Set up collection and storage:
- Deploy collectors/agents
- Configure scraping/shipping
- Set retention policies
Create Dashboards
Build meaningful visualizations:
- Service health dashboards
- Infrastructure dashboards
- Business metrics dashboards
Configure Alerts
Define alerting rules:
- SLO-based alerts
- Anomaly detection
- Alert routing and escalation
Key Takeaways
Three Pillars: Logging, tracing, and metrics provide complete system observability
Logging: Records discrete events; highest volume; uses ELK stack for analysis
Tracing: Request-scoped tracking across services; identifies bottlenecks; uses OpenTelemetry
Metrics: Aggregatable performance data; uses Prometheus and Grafana; enables alerting
Cloud Monitoring: Major providers offer comprehensive monitoring solutions with various trade-offs
Architecture Matters: As Amazon Prime Video showed, the right architecture can save 90% in costs
Related Topics
DevOps & CI/CD
Learn about DevOps practices and CI/CD pipelines
Kubernetes & Docker
Explore containerization and orchestration